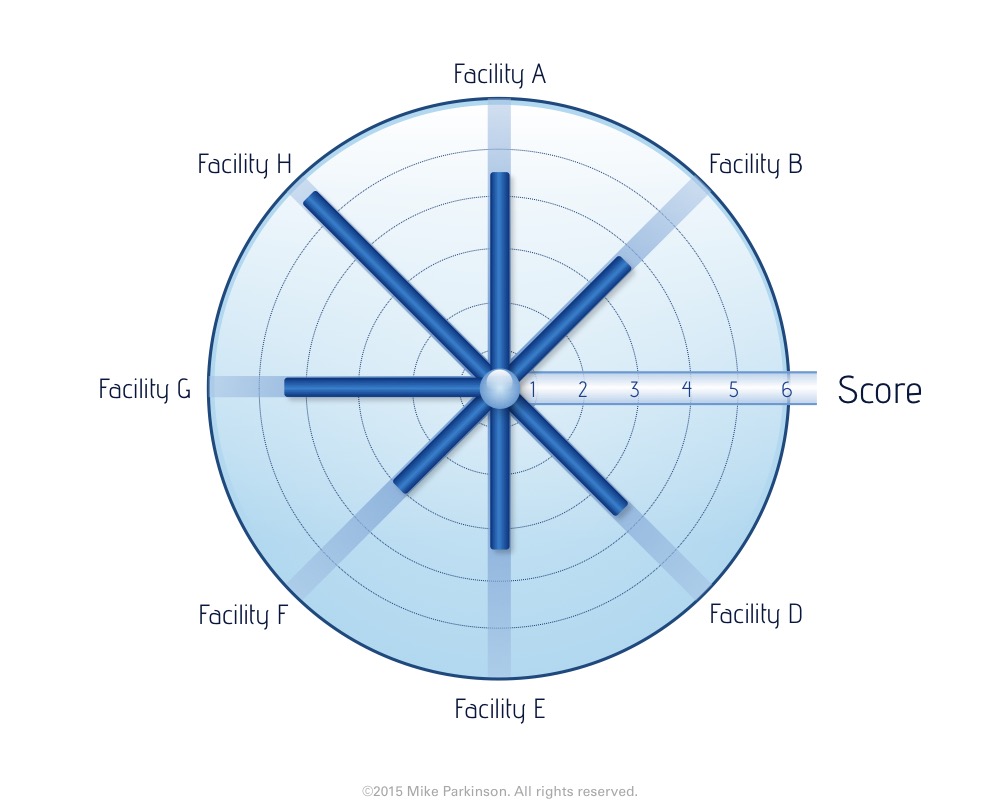
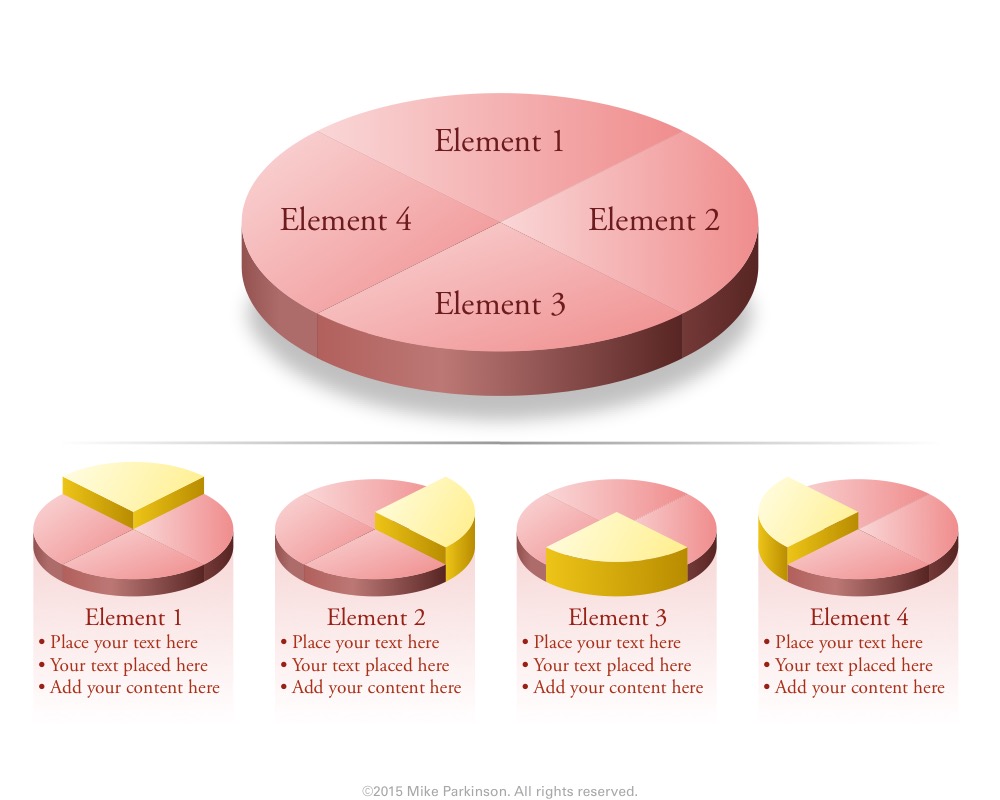
Circle Chart 2
Use this Circle Chart to show changing amounts, values, or time. (This graphic is NOT data driven.)

Use this Circle Chart to show changing amounts, values, or time. (This graphic is NOT data driven.)

Use this Circle Chart to show changing amounts, values, or time. (This graphic is NOT data driven.)
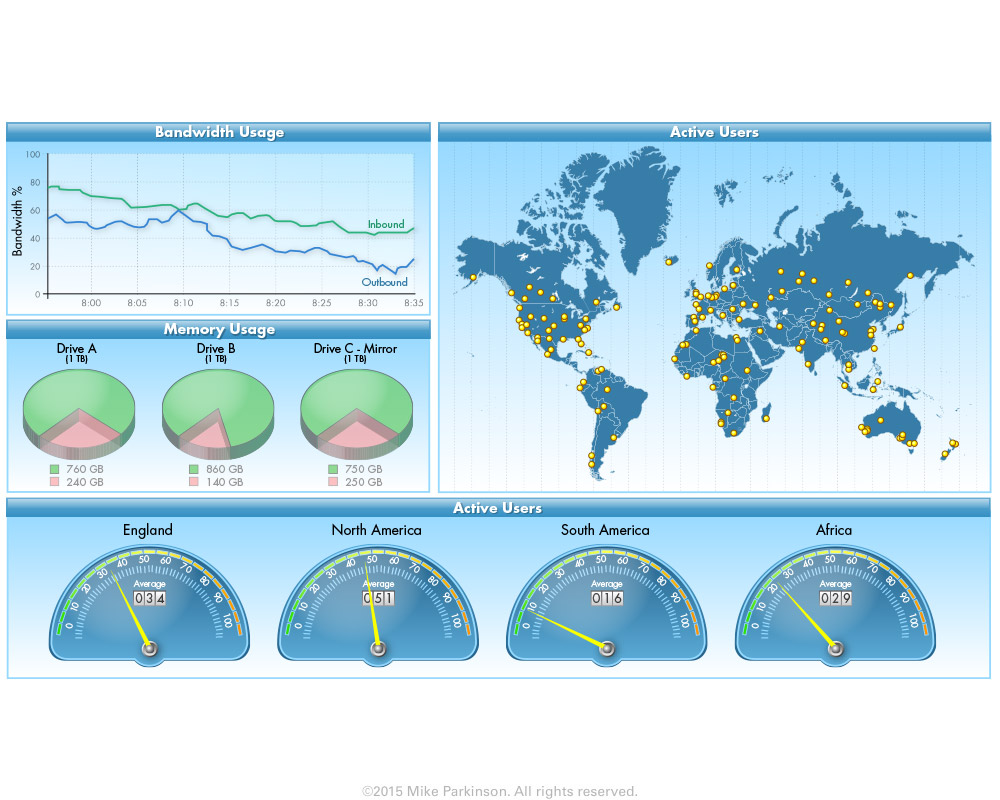
Use this Dashboard Graphic to show multiple metrics in one consolidated format. The line chart and pie charts are data…
Use this Dashboard Graphic to show multiple metrics in one consolidated format. The line chart and pie charts are data…
Use this Dashboard Graphic to show multiple metrics in one consolidated format. The line chart and pie charts are data…
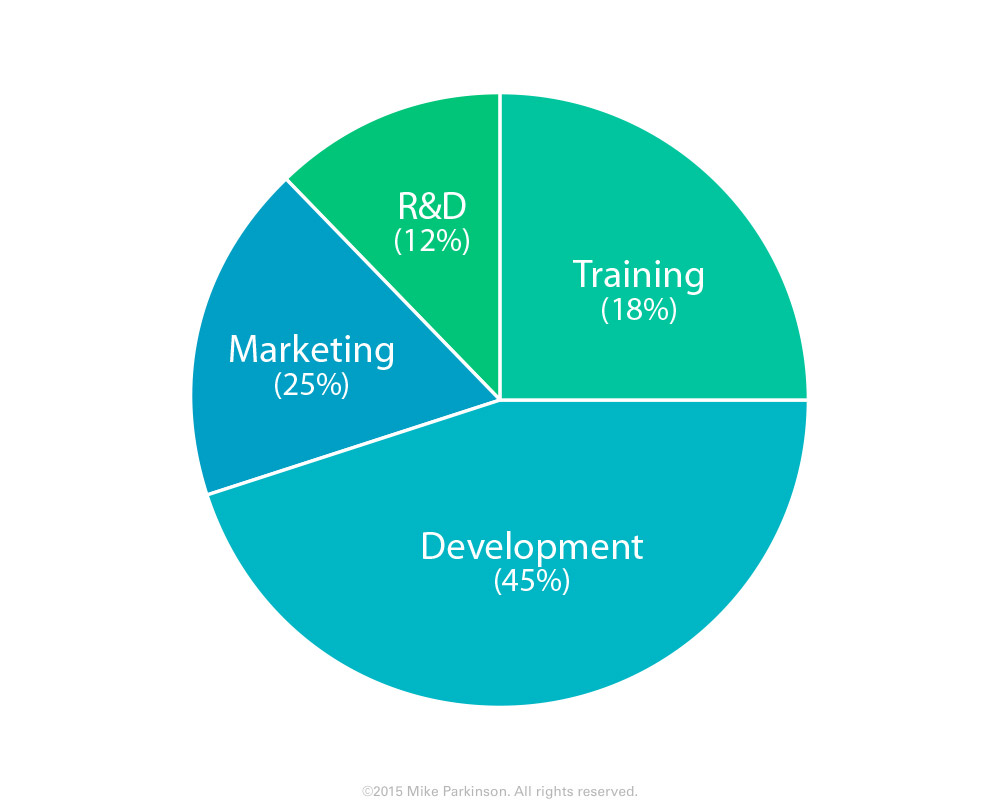
Use this Pie Chart to show percentages relative to the whole.
Use this Pie Chart to show percentages relative to the whole.
Use this Pie Chart to show percentages relative to the whole.
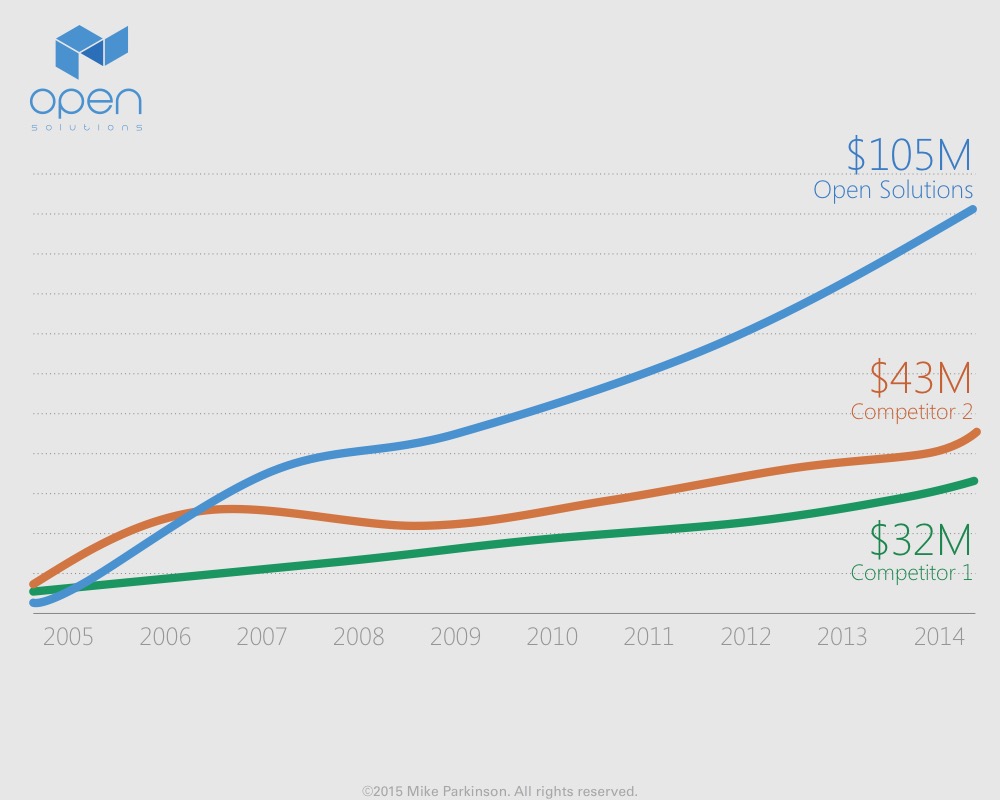
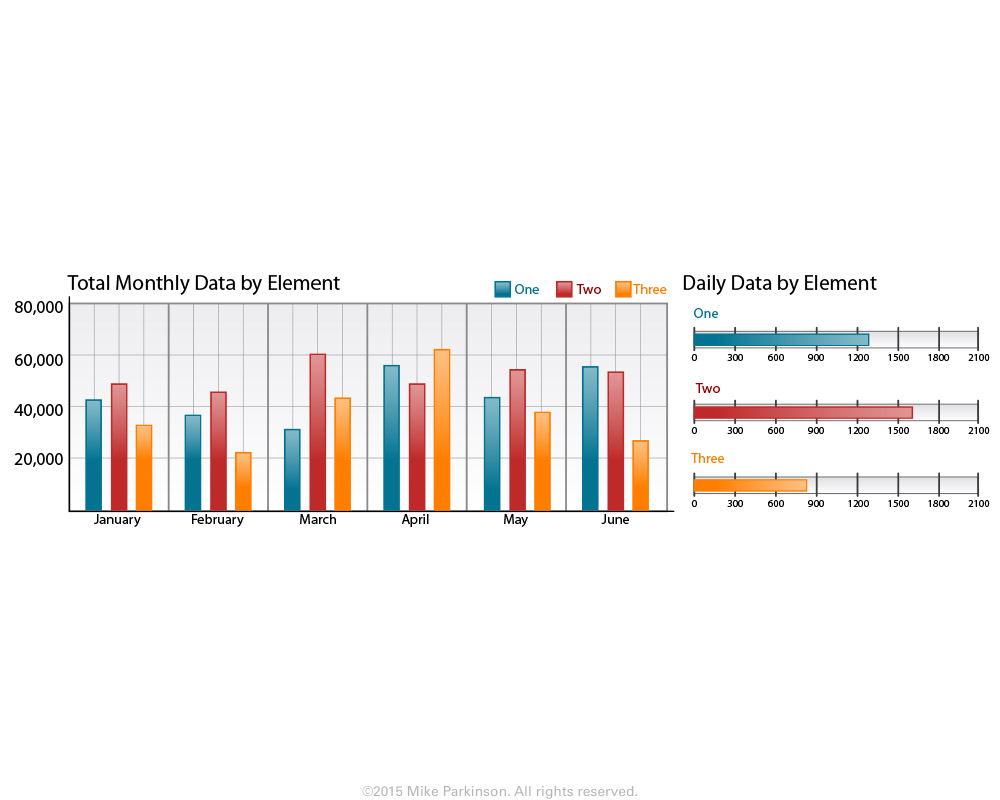
Use this Line Chart/Bar Chart hybrid to show quantitative data. This graphic is data driven.
Use this Line Chart/Bar Chart hybrid to show quantitative data. This graphic is data driven.
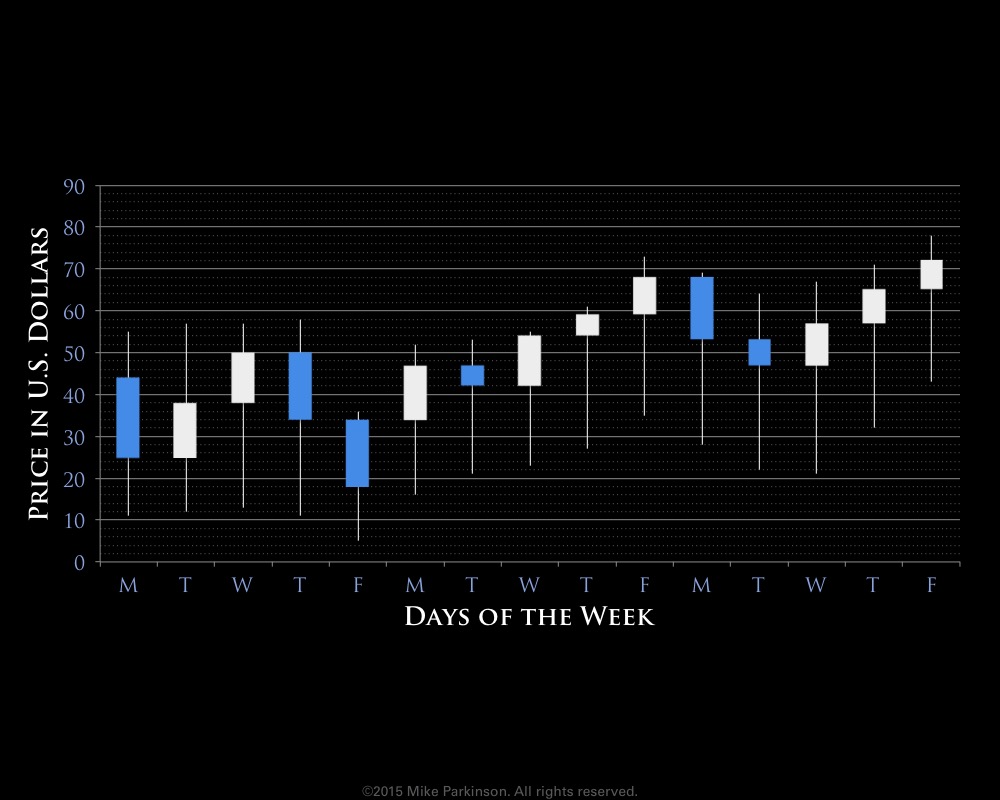
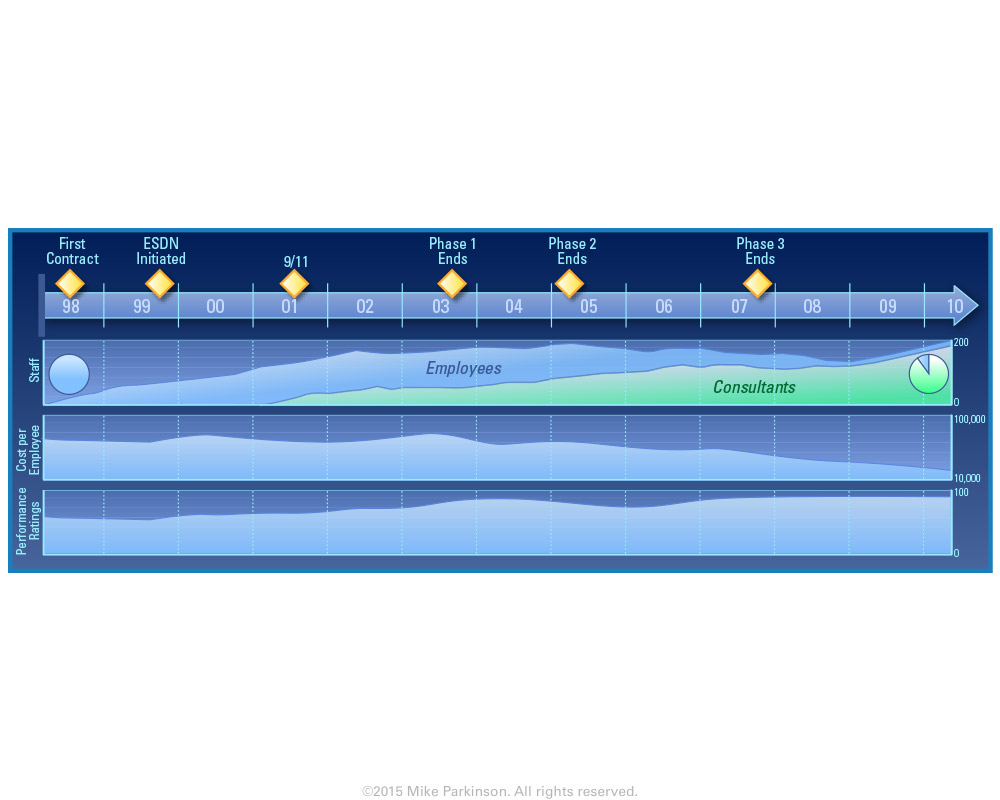
Use this Candlestick Chart to show changes in value and other information pertaining to stocks, bonds, commodities, etc. This graphic…
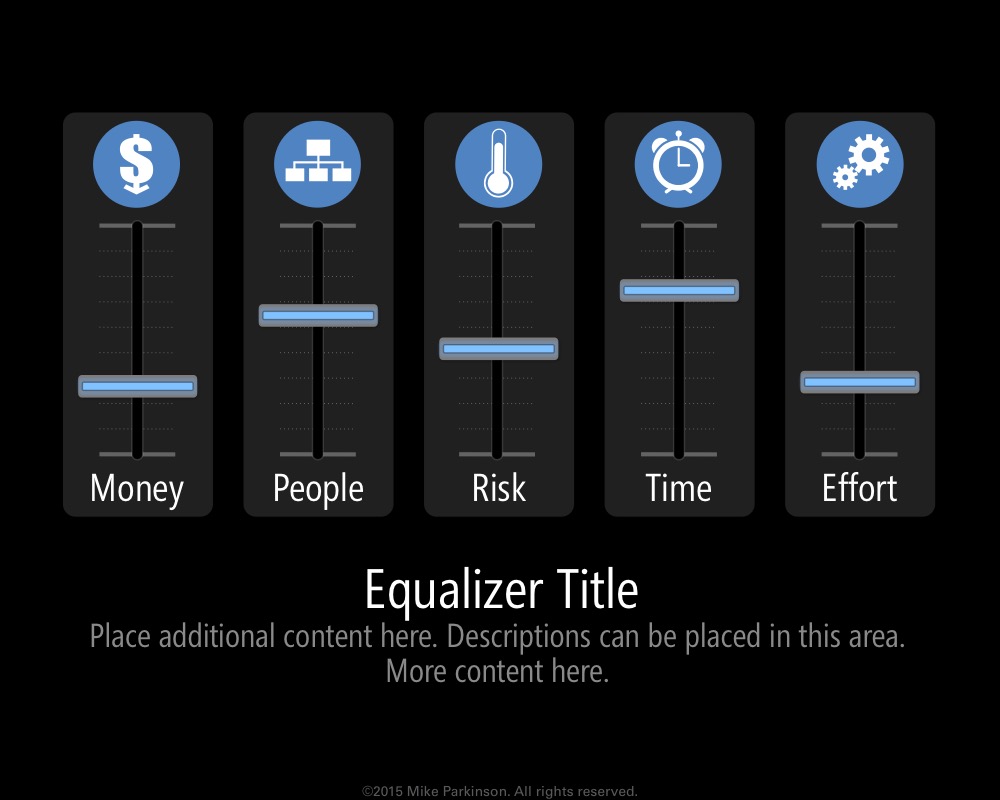
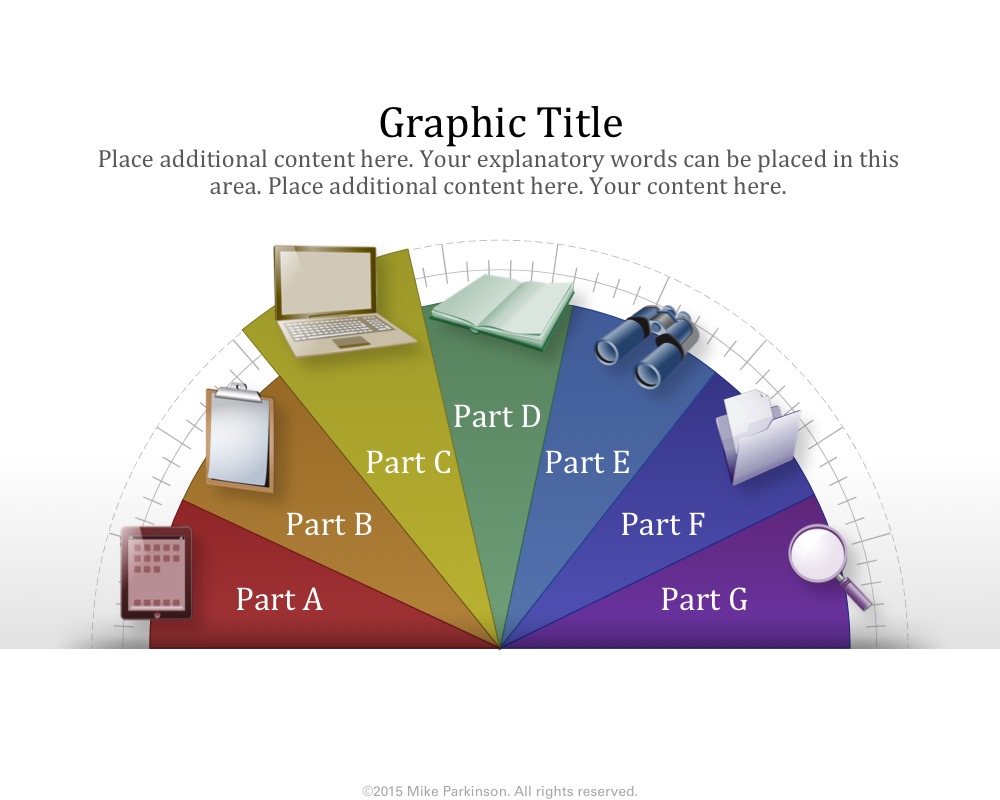
Use this Gauge Graphic to present data in a unique and professional way.